Accelerate your growth: master the art of sales excellence

Get management ready insights into your sales funnel in real time through out-of-the-box charts in the style of top management consultants

Sales_Excellence_Laptop

Why you need ValueWorks as an add-on to your CRM system

Effective sales funnel management requires a clear view of the customer journey in your sales processes. A traditional CRM system displays only current data, which is not ideal for executive management. To facilitate vital management analysis, you need a tool that provides historical data, offering insights into data trends over time, such as conversion rates. This is crucial for executives to understand the duration of each funnel phase and pinpoint where unnecessary delays occur, a capability lacking in a standard CRM system.

How ValueWorks performs advanced analytics

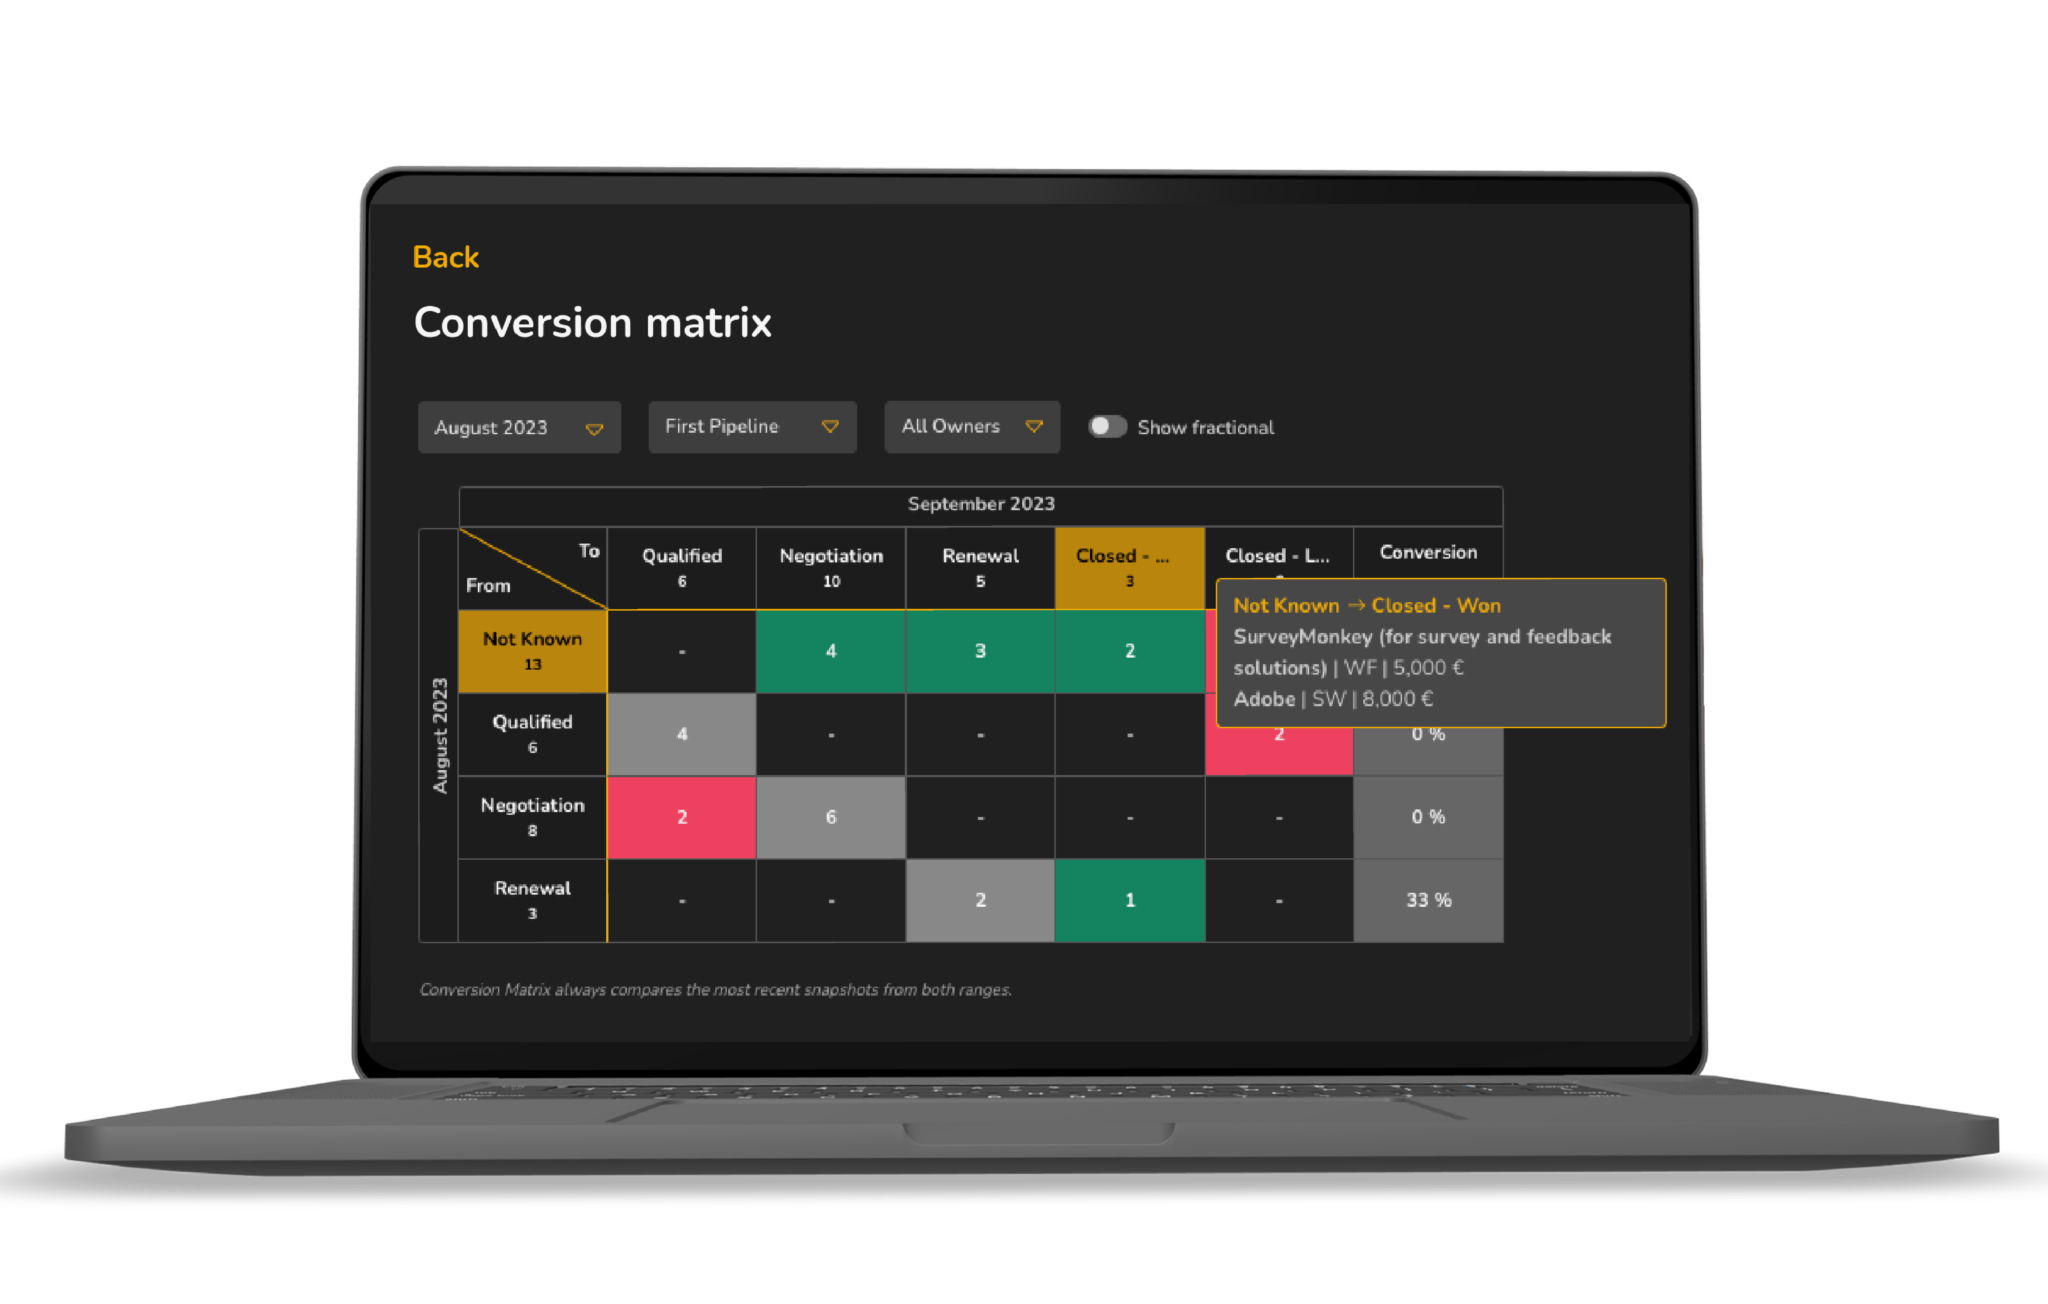
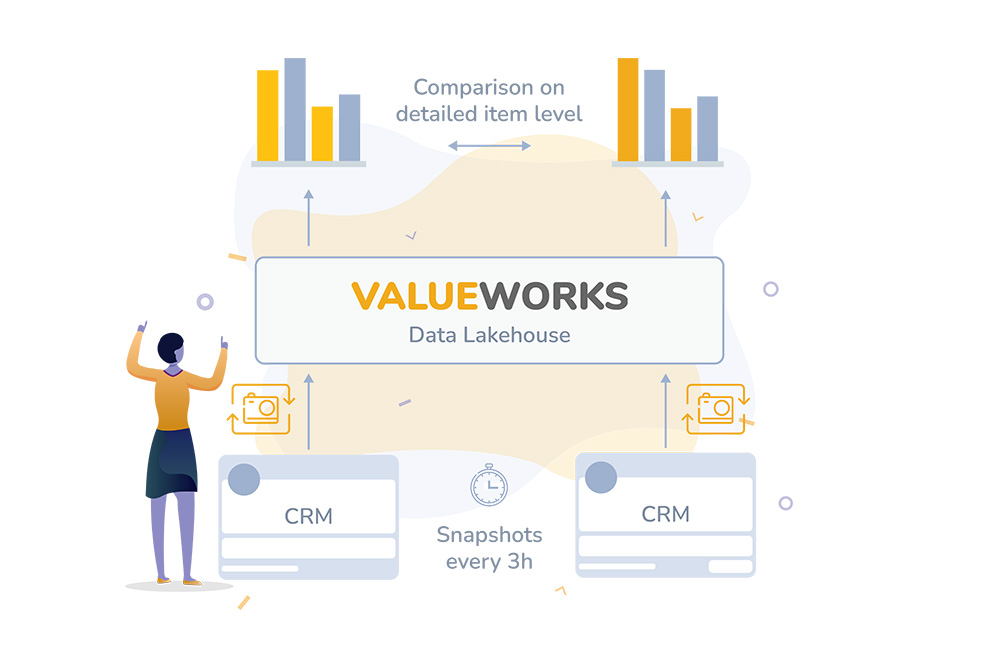
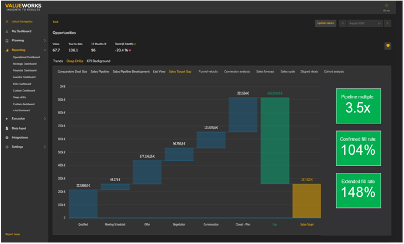
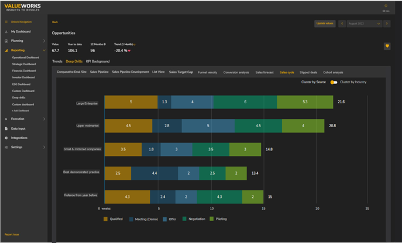
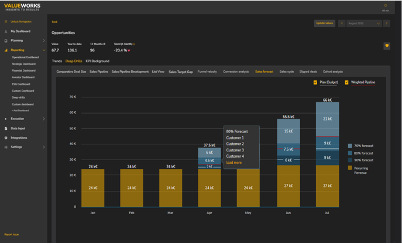
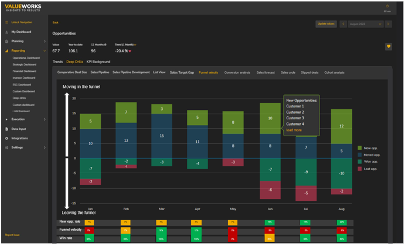
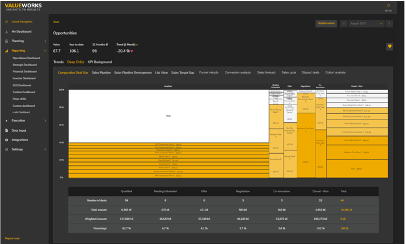
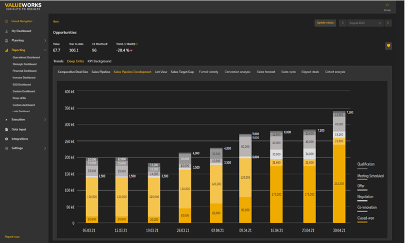
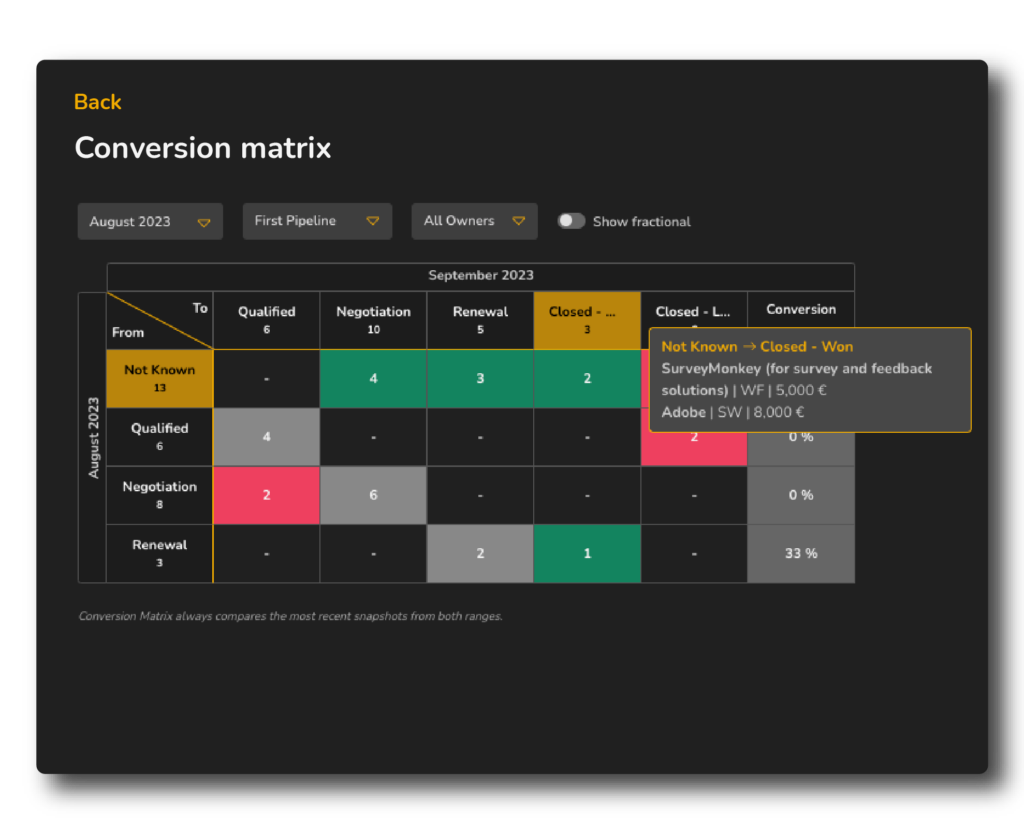
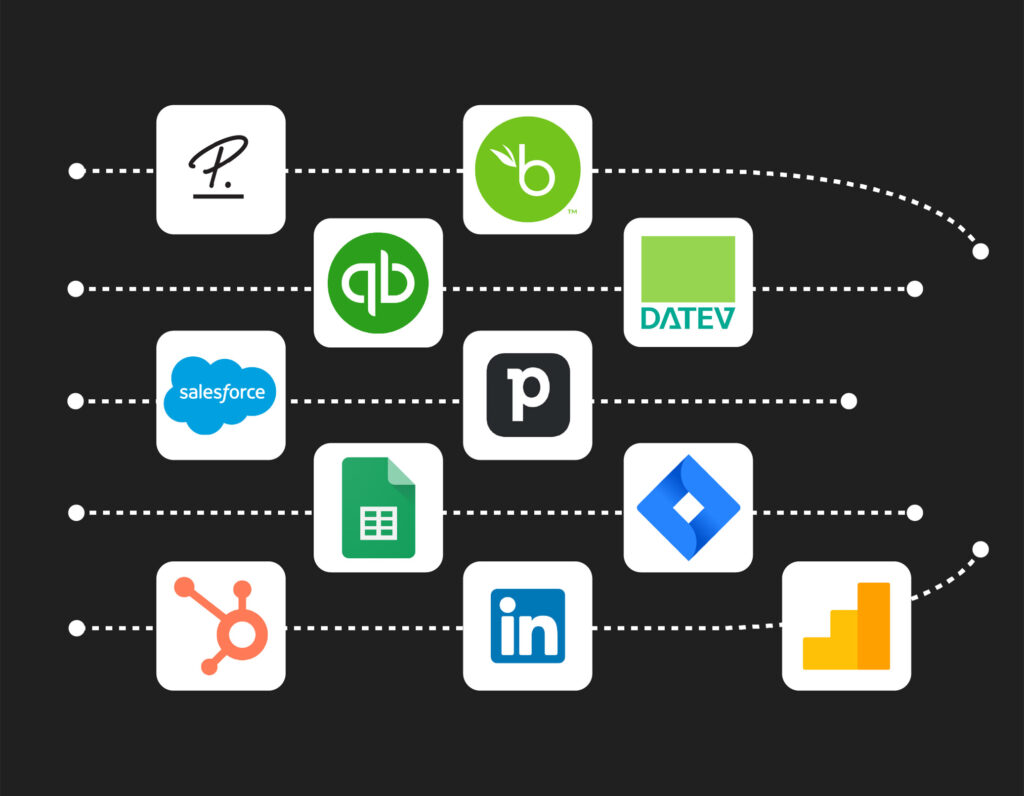
The sales excellence tool of ValueWorks performs a comparison between any point-in-time to calculate conversions e.g. from SQL to “offer” phase, number of “slipped deals” and sales cycle time, by taking snapshots from the CRM system, every 3 hours. Unlike a CRM system, ValueWorks integrates data from different sources, which, in addition to the presentation of classic sales KPIs, such as leads, also helps to display the costs.

All of your sales activities in one system

With out-of-the-box top management charts based on sales funnel visualizations, identifying the most important deals in your sales funnel to mobilize all functions for deal closure

Thumbnail sales excellence video
Play Video about Thumbnail sales excellence video

What our sales excellence tool can do

Snapshot technology

Enable proper conversion rate calculation leveraging „snapshot“ technology to perform advanced analytics. Every 3 hours ValueWorks pulls a complete snapshot of data from the CRM system to allow comparison between different points in time.

Sales-cycle analysis

Sales cycle analysis is the best proven practice to generate considering the shortest cycle per phase. Sales cycles should be shortened to generate revenue early and acceleration of growth. Sales cycle should be analyzed by company size, industry, country, product offered

Sales forecast

The sales forecast on a monthly basis takes into account not only new business but also existing business. Sales are sorted by probability with the 100% certain sales at the bottom. Also showing the weighted value of the pipeline per month.

Sales velocity

The sales velocity is a KPI that counts the opps that moved forward to next stage(s) w/in a certain timeframe. It tells you if the funnel is running smoothly.

Sales-pipeline multiple

The Pipeline multiple is analyzing the current value of the sales pipeline compared to the specified sales target in a quarter. (inkl. Contracted close rate & extended fill rate) e.g. comparing value of "closed, won" deals with the sales target.

Cohort analysis

Very popular for identifying patterns in customer behavior is cohort analysis. In each case, it is possible to analyze what percentage of customers cancelled or extended their contract in which subsequent month. Both percentage and absolute analysis is possible.

Self-service oriented user interface

Enables simple & quick understanding of the sales funnel

ValueWorks enabling proper conversion rate calculation leveraging „snapshot“ technology.
In contrast to the traditional representation, the Marimekko representation of the sales funnel arranges the deals per phase according to their size from bottom to top. The colouring also supports the quick recognition of the large and important deals.
The fill level of the sales pipeline is monitored on a weekly basis using the following illustration. The values are sorted by probability of success from bottom to top, so that the fill rate can be quickly identified.​
Analyzing the current value of the sales pipeline compared to the specified sales target in a quarter.

Frequently asked questions

The sales excellence deep drills depend on your sales data, i.e., your CRM. Of course the better the data quality is, the better the insights will be. More specifically, you will need to maintain information on your sales funnel objects, e.g., a correct close data for a deal, what products the deal is related to, or when what revenue can be expected.
The charts are based on long-standing management consulting experience and represent our suggestions for optimal sales funnel management. As such, they can be filtered and minimally altered, but free chart creation is covered by our charts feature, which enables 100% flexibility when it comes to chart creation.
If the data quality is optimal, the correct charts will be available right after the integration of the required system. To reach the required data quality, you can of course leverage our data quality check, that will provide actionable recommendations for improvements.

WHITEPAPER

What should the executive management know about the sales funnel?

How startups, scale-ups & midsize companies can increase their sales performance through active sales funnel management

WHITEPAPER

Management-ready sales reports out-of-the-box you can not get from your CRM

Why you need ValueWorks as an add-on to your CRM system to perform crucial management analysis

Harness the power of ValueWorks, the intelligence platform for executives

Make ValueWorks the starting point of every management decision

Industry solutions

ValueWorks provides industry specific templates with the right KPIs for each industry

Investor reporting

Most modern way of investor communications and alignment

OKR 2.0

Next generation agile management with OKR 2.0

Integrations

Connecting your favorite tools via plug & play integration of the operational systems

Start a free trial!

Start today to better drive the direction of your company with ValueWorks.

Want to know more?

What is your name?
What is your email?
What is the name of your company?
What is your role in this company?