


This blog post is about how startups, scale-ups and midsize companies can increase their sales performance through active sales funnel management. Besides the definition of sales excellence and why sales funnel management is also relevant for executive management, we give some insights into the most important key figures for the analysis of sales funnel management and how they can be illustrated with the help of our software.
Sales Excellence
The term “sales excellence” became a classic in business management literature in 2016 as part of the book of the same name by Christian Homburg, Heiko Schäfer and Janna Schneider. Since then, “sales management with a system” has successfully established itself in more and more companies and has become one of the most common methods for sustainably increasing sales success. Read in this whitepaper by ValueWorks Co-Founder & CEO, Dr. Wolfgang Faisst, how you, as a founder, managing director for member of the executive board of a startup, scale-up or medium-sized company, can benefit from excellent performance in sales through active sales-funnel management.
What should the management know about the topic “Sales-Funnel”?
What should the management know about the topic “Sales-Funnel”?
Motivation
Sales Excellence is an analytical approach to the continuous development of sales and its adaptation to internal and external changes. The goal of Sales Excellence is to free sales from coincidences or individual idiosyncrasies. At the heart of Sales Excellence is the professional management of the “sales funnel” or “sales pipeline”.
Although this topic is of central importance for business success and is therefore not only a topic for the sales management, but also for the executive management, there is often a lack of the necessary transparency as to how healthy the current “sales funnel” is or where false hopes are being placed, which then vanish into thin air at the end of the quarter or year. This is often associated with mutual accusations. This white paper provides an overview of professional sales funnel management from an executive perspective and offers practical recommendations for implementation and organizational anchors. The following figure shows a typical sales funnel using the example of a software company for business
customers.

Illustration 1: “Sales Funnel” – Sales funnel
Why should a sales funnel be managed as professionally as possible?

Illustration 2: WHY the sales funnel should be managed competently
Most important key figures for the analysis of the sales funnel
The following chart demonstrates the most important 10 key figures for professional sales funnel management, including their background and significance.

Illustration 3: Relevant KPIs for sales funnel management
The illustration on the next page shows the weighted sales pipeline in a staircase representation. Each stage of the funnel is represented by a stair step. The aggregated height of the staircase in blue represents the cumulative value of the deals assessed with success probabilities. This is compared to the target value in the current quarter when calculating the pipeline multiple. If the value is >1, the bar between the blue staircase on the left and the orange sales target on the right is colored in green. However, a pipeline multiple of >1 does not guarantee that the planned sales in the quarter will be achieved. This can be because the sales department estimates the probability of success too positively or that deals are delayed, and the planned closing date cannot be met. Therefore, experience
shows that a pipeline multiple of >2 should be aimed for in order to be on the safe side.
Towards the end of each quarter, the confirmed fill rate is particularly important. This measures the percentage by which the sales target has already been reached. For the Extended Fill Rate, the weighted value of the stage before the contract is signed is added. This value should be >100% in order to still have a chance of closing the missing sales to reach the target by the end of the quarter and thus achieving the sales target.
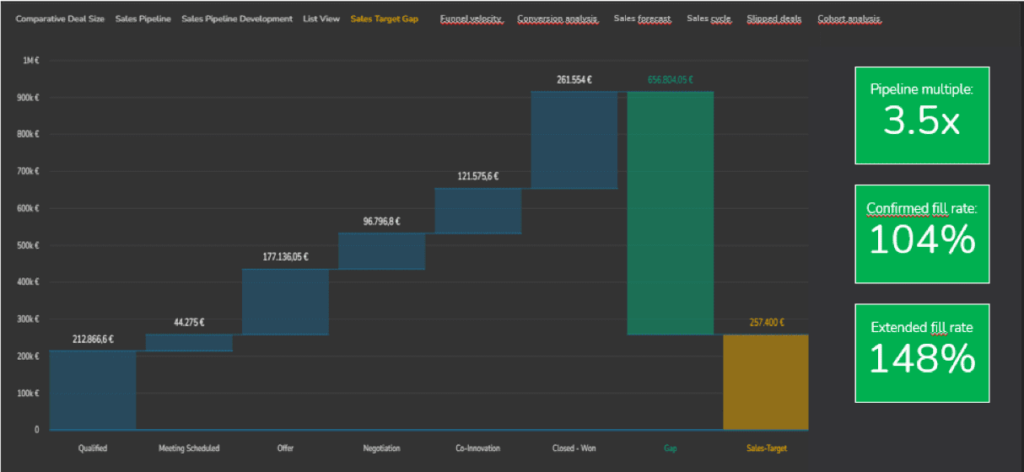
Illustration 4: Sales pipeline multiple (weighted vs. sales target)
The fill level of the sales pipeline is monitored on a weekly basis using the following illustration. The weighted deals per funnel phase are shown in different colors. The values are sorted by probability of success from bottom to top, so that the fill rate can be quickly identified.
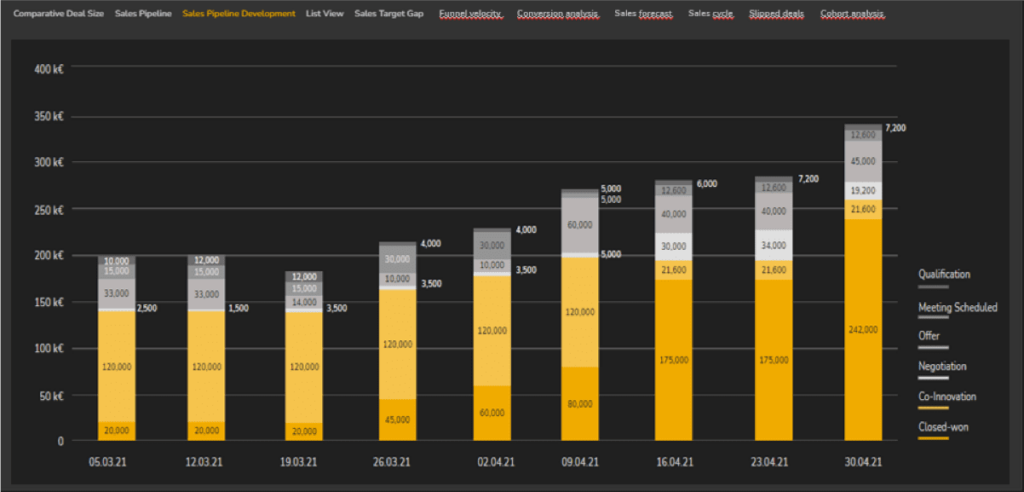
Illustration 5: Dynamics of the sales funnel (week by week)
While the last two figures focus on new business, the following illustration deals with the sales forecast at monthly level. This takes into account existing contracts and thus the existing business.
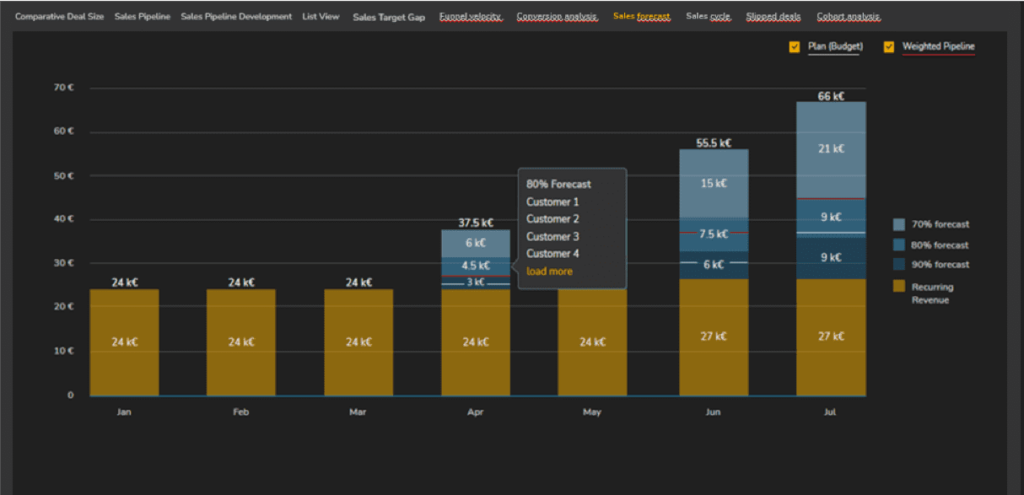
Illustration 6: Sales forecast according to probability
Since the chance of success for closing a sale increases with each phase in the sales funnel, the executive management should look at the “conversion rates” per phase. The figure below shows the respective fill level per phase in the funnel, the respective conversion rates from phase to phase. The latter are highlighted in color in ValueWorks depending on the traffic light status. The traffic light status is calculated by comparing the actual status with the target value that was planned to achieve the sales targets. This also results in planned values or target values for the fill level per phase, so that the management can easily determine how many opportunities are still missing per phase.
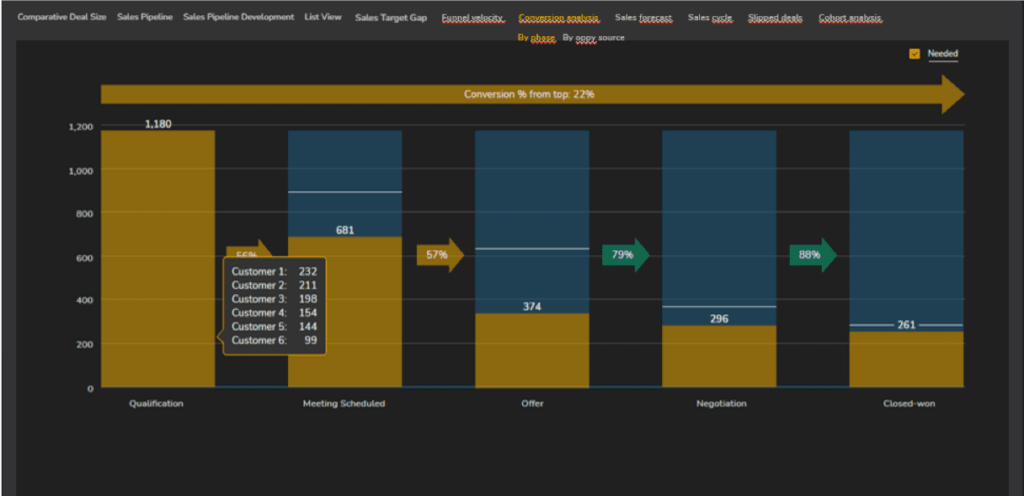
Illustration 7: Conversion analysis
The duration of a sales phase or the entire sales process has a significant influence on conversion in a period. Therefore, the duration of the entire cycle or individual phases should be examined more closely. For this purpose, it is advisable to perform an analysis according to customer groups, regions, or products in order to make differences visible. It is also advisable to derive a “best demonstrated practice” with the fastest phase runs. It is then very easy to derive the potential for improvement from this.
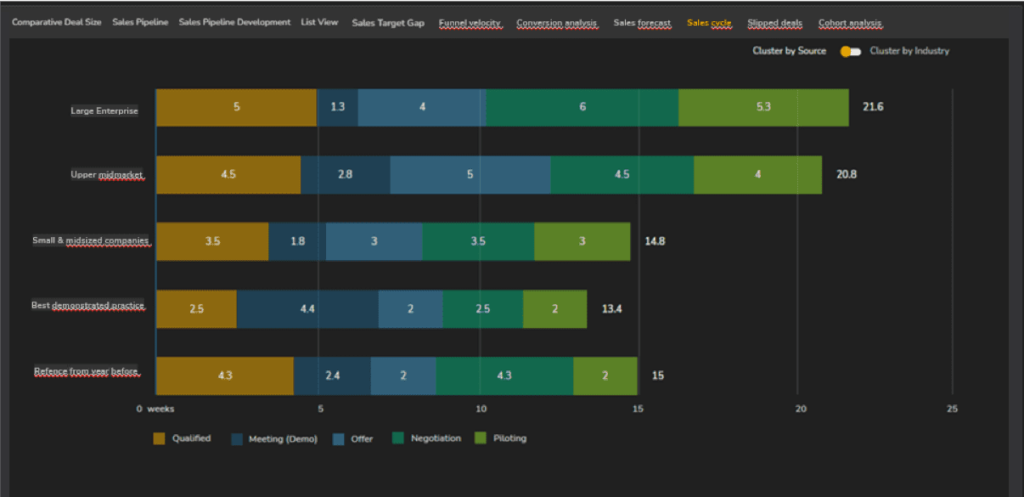
Illustration 8: Sales cycle analysis: lead times and how to short them
Very popular for identifying patterns in customer behavior is cohort analysis. The illustration below shows an example of cohorts of customers who became customers in October 2021, November 2021, etc. became customers. In each case, it is possible to analyze what percentage of customers cancelled or extended their contract in which subsequent month. Both percentage and absolute figure analysis is possible.
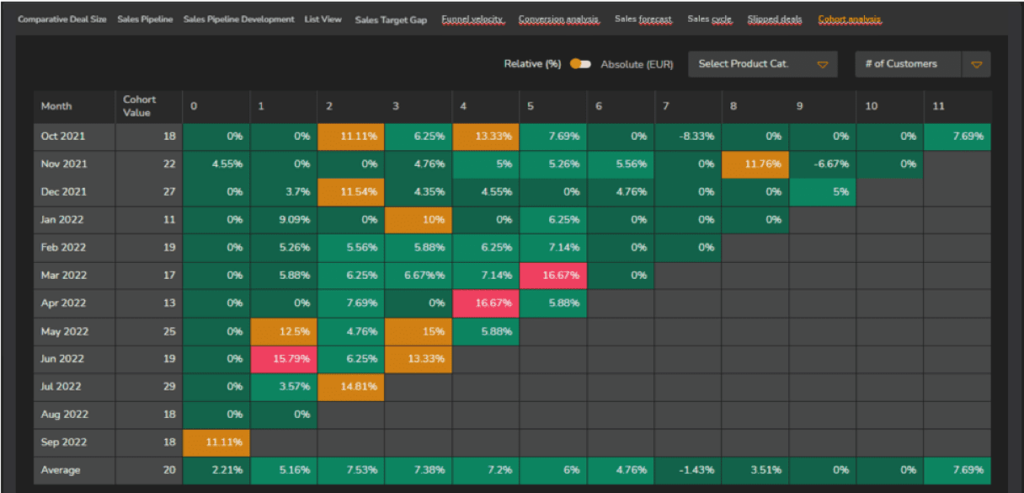
Illustration 9: Cohort analysis: “Patterns in customer acceptance/ expansion & churn
Outlook
ValueWorks, the intelligent operating system for founders and the management of startups, scaleups and mid-sized companies, offers its own approach to implementing sales excellence. By consistently merging data from all relevant operational, strategic and financial business systems, you get deep insights into your revenue situation in real time through meaningful sales graphs at management consulting level.
Whitepaper: What should the executive management know about the sales funnel?
How startups, scale-ups and midsize companies can increase their sales performance through active sales funnel management.