


Investor reports are an important way for startups and their backers to talk to each other. They show not only how well your company is doing financially, but also how well it is running, what its strategic direction is, and what its future potential is. A well-thought-out investor report can help your company and its investors build trust, be more open, and improve their relationship with each other. This blog post will show you the most important parts of a good investment report, such as the executive summary, key performance indicators (KPIs), deep-dive graphics, financial P&L, liquidity analysis, and attachments.
Frequency
A good frequency for reporting your results is quarterly. This gives you enough time to show some traction, and on the other hand minimizes overhead.
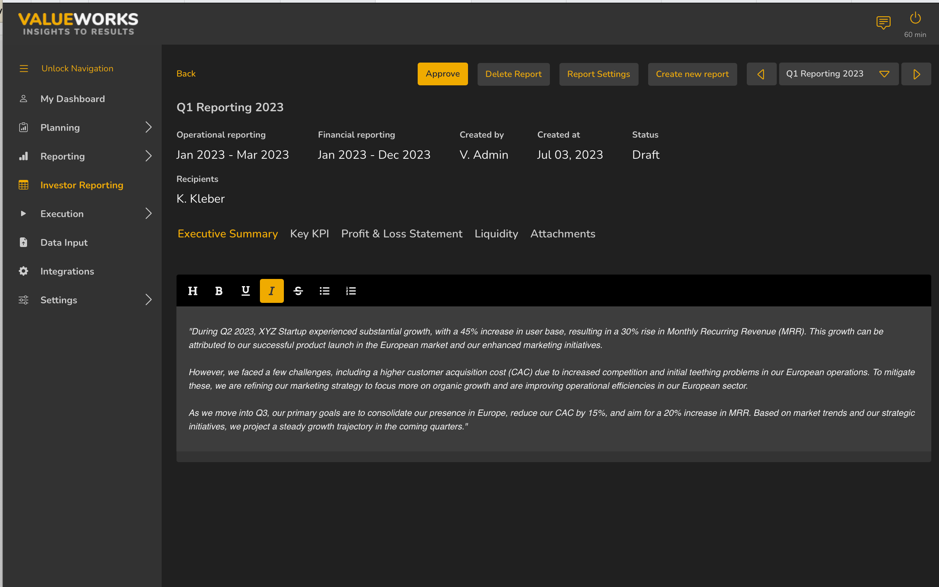
Executive Summary
Start your report with a short outline of your startup’s progress and where it is right now. This part should give a quick summary of important events, milestones, challenges, and a look ahead. Highlight the main goals of your startup and any big changes in your strategic plan or the market. Describe risks and how you plan to deal with them.
“During Q2 2023, XYZ Startup experienced substantial growth, with a 45% increase in user base, resulting in a 30% rise in Monthly Recurring Revenue (MRR). This growth can be attributed to our successful product launch in the European market and our enhanced marketing initiatives.
However, we faced a few challenges, including a higher customer acquisition cost (CAC) due to increased competition and initial teething problems in our European operations. To mitigate these, we are refining our marketing strategy to focus more on organic growth and are improving operational efficiencies in our European sector.
As we move into Q3, our primary goals are to consolidate our presence in Europe, reduce our CAC by 15%, and aim for a 20% increase in MRR. Based on market trends and our strategic initiatives, we project a steady growth trajectory in the coming quarters.”
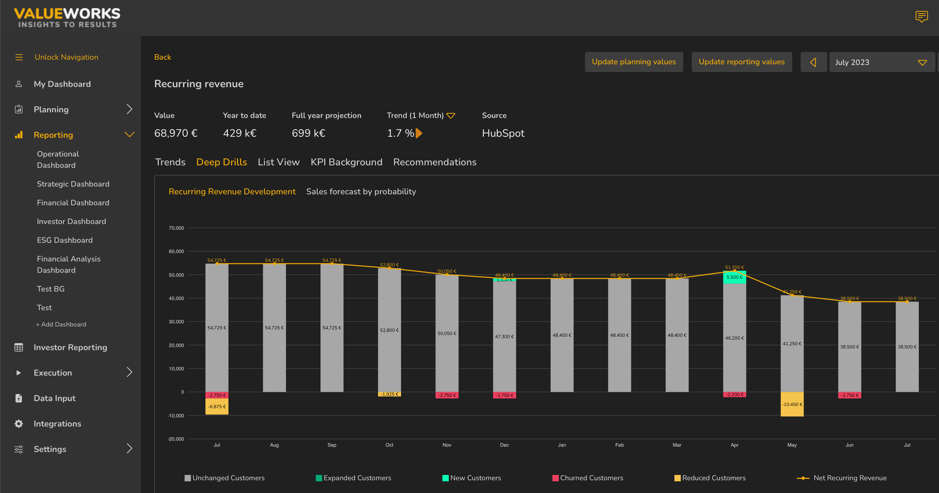
Key Performance Indicators (KPIs) & Deep-Dive Graphics
KPIs offer a snapshot of your startup’s performance and should align with your business goals. Common KPIs for startups, particularly in the SaaS field, might include Monthly Recurring Revenue (MRR), Customer Acquisition Cost (CAC), Lifetime Value of a Customer (LTV), and churn rate.
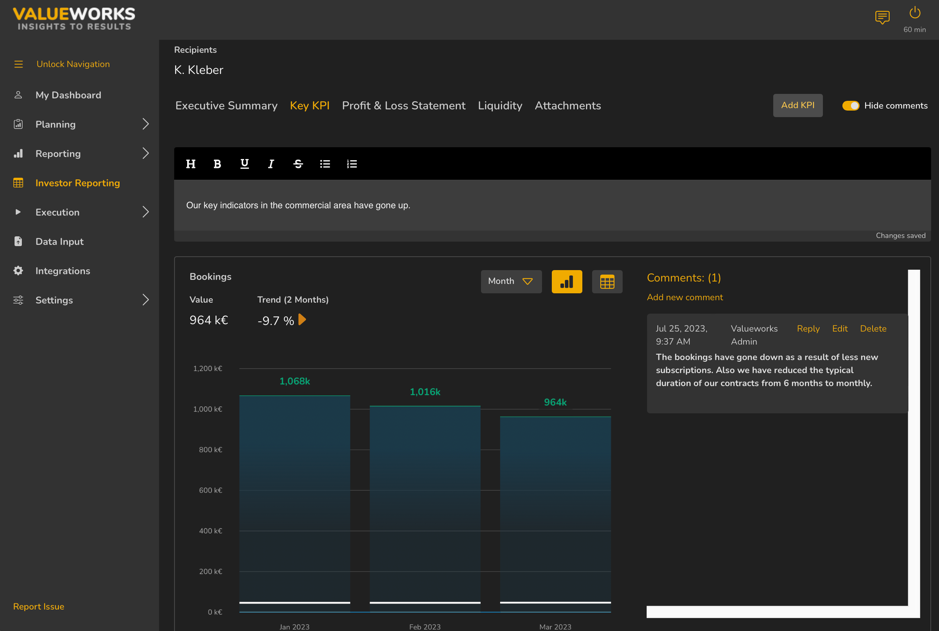
Complement your KPIs with deep-dive graphics, which make complex data easier to understand and digest. These could include visuals such as revenue growth graphs, customer acquisition funnels, or churn rate charts. Ensure these visuals are simple to interpret, accurately presented, and complement the narrative of your KPIs.
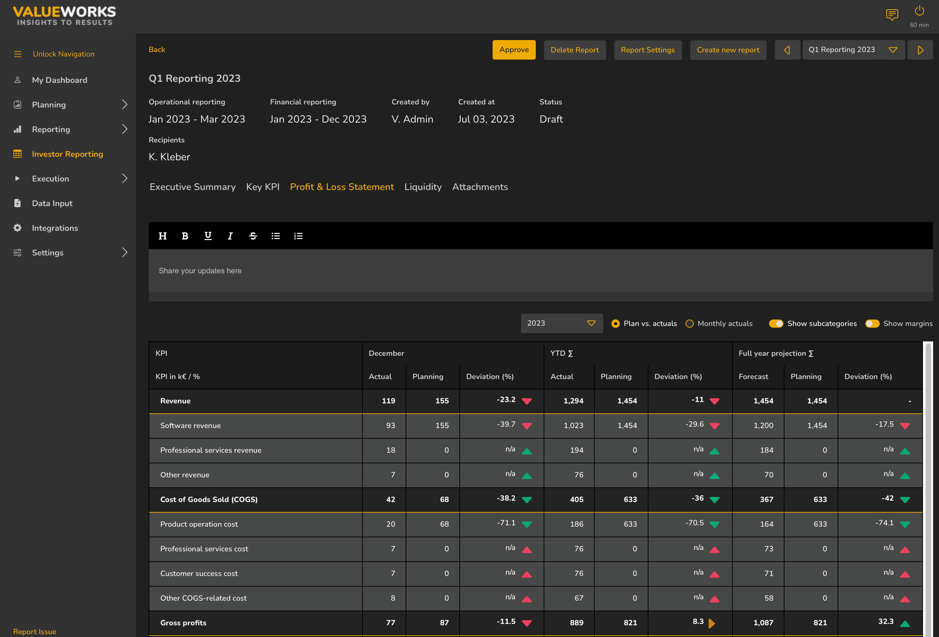
Financial Profit & Loss Statement (P&L)
The P&L statement is an integral part of your investor report, providing insights into operational profitability and the effectiveness of your business model. This statement includes details about your revenue, Cost of Goods Sold (COGS), Gross Profit, Operating Expenses (OPEX), and Net Income. To offer context, compare these figures with previous periods and provide a variance analysis.
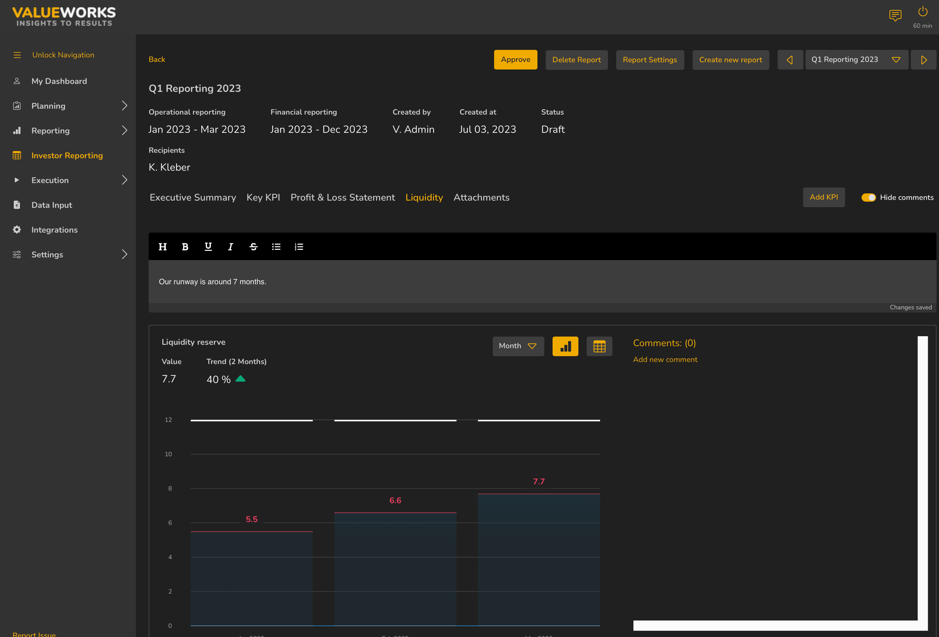
Liquidity Analysis
A liquidity analysis demonstrates your startup’s ability to meet short-term liabilities with its short-term assets. It’s a crucial component for investors, as it indicates how prepared your startup is to handle financial setbacks. Key metrics include the Current Ratio (Current Assets / Current Liabilities) and the Quick Ratio [(Current Assets – Inventory) / Current Liabilities], both offering insights into your startup’s financial stability.
Attachments
Attachments offer additional details that didn’t fit into the main body of your report. These could include detailed tables, additional data points, and other relevant supporting information. These attachments provide an opportunity for interested investors to delve deeper into the specifics, thereby enriching their understanding of your startup.
Transparency is a guiding principle in crafting your investor report. By presenting a complete and accurate picture of your startup, you build trust and show your grasp on the business and its metrics. Comprehensive, user-friendly reports enable investors to swiftly understand your startup’s performance and trajectory, which can prove instrumental in maintaining investor confidence and securing future funding. In summary, a strategically composed investor report can significantly contribute to your startup’s success by fostering enduring investor relationships.
Transparency is a guiding principle in crafting your investor report. By presenting a complete and accurate picture of your startup, you build trust and show your grasp on the business and its metrics. Comprehensive, user-friendly reports enable investors to swiftly understand your startup’s performance and trajectory, which can prove instrumental in maintaining investor confidence and securing future funding. In summary, a strategically composed investor report can significantly contribute to your startup’s success by fostering enduring investor relationships.