Situation: complex cost-structures of projects in professional service companies
Professional service companies as management consultancies, IT consultancies, creative -, media- or recruitment agencies work in a project-based business model. The project code serves as the primary key to merge data around a project such as turnover and costs of individual projects.
Costs in the professional service industry are created by:
Costs in the professional service industry are created by:
- the use of consultancy resources charged to the project and associated travel expenses
- the purchase of external resources or materials needed for the project
- the addition of overhead costs and handling fees (Den Zuschlag von Umlagen)
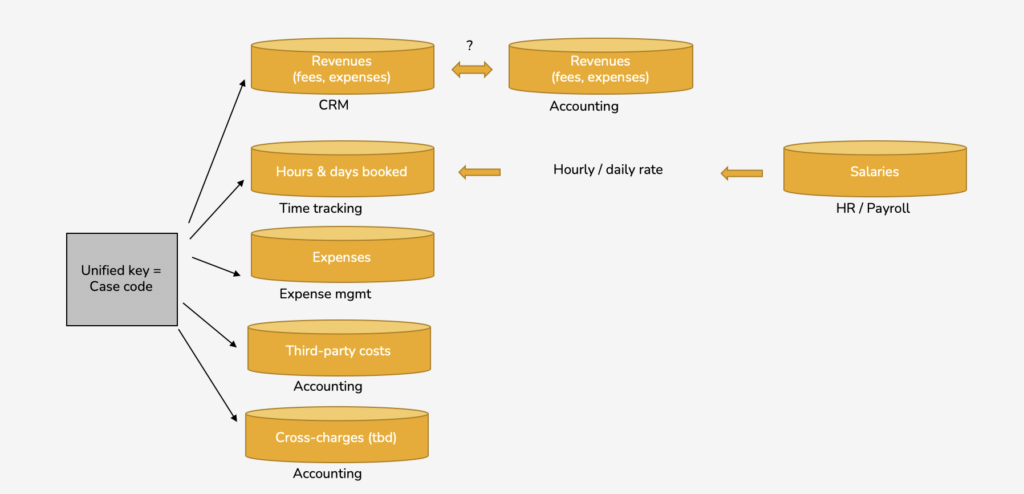
Challenges: data-silos imply a lot of manual effort to calculate the project profitability
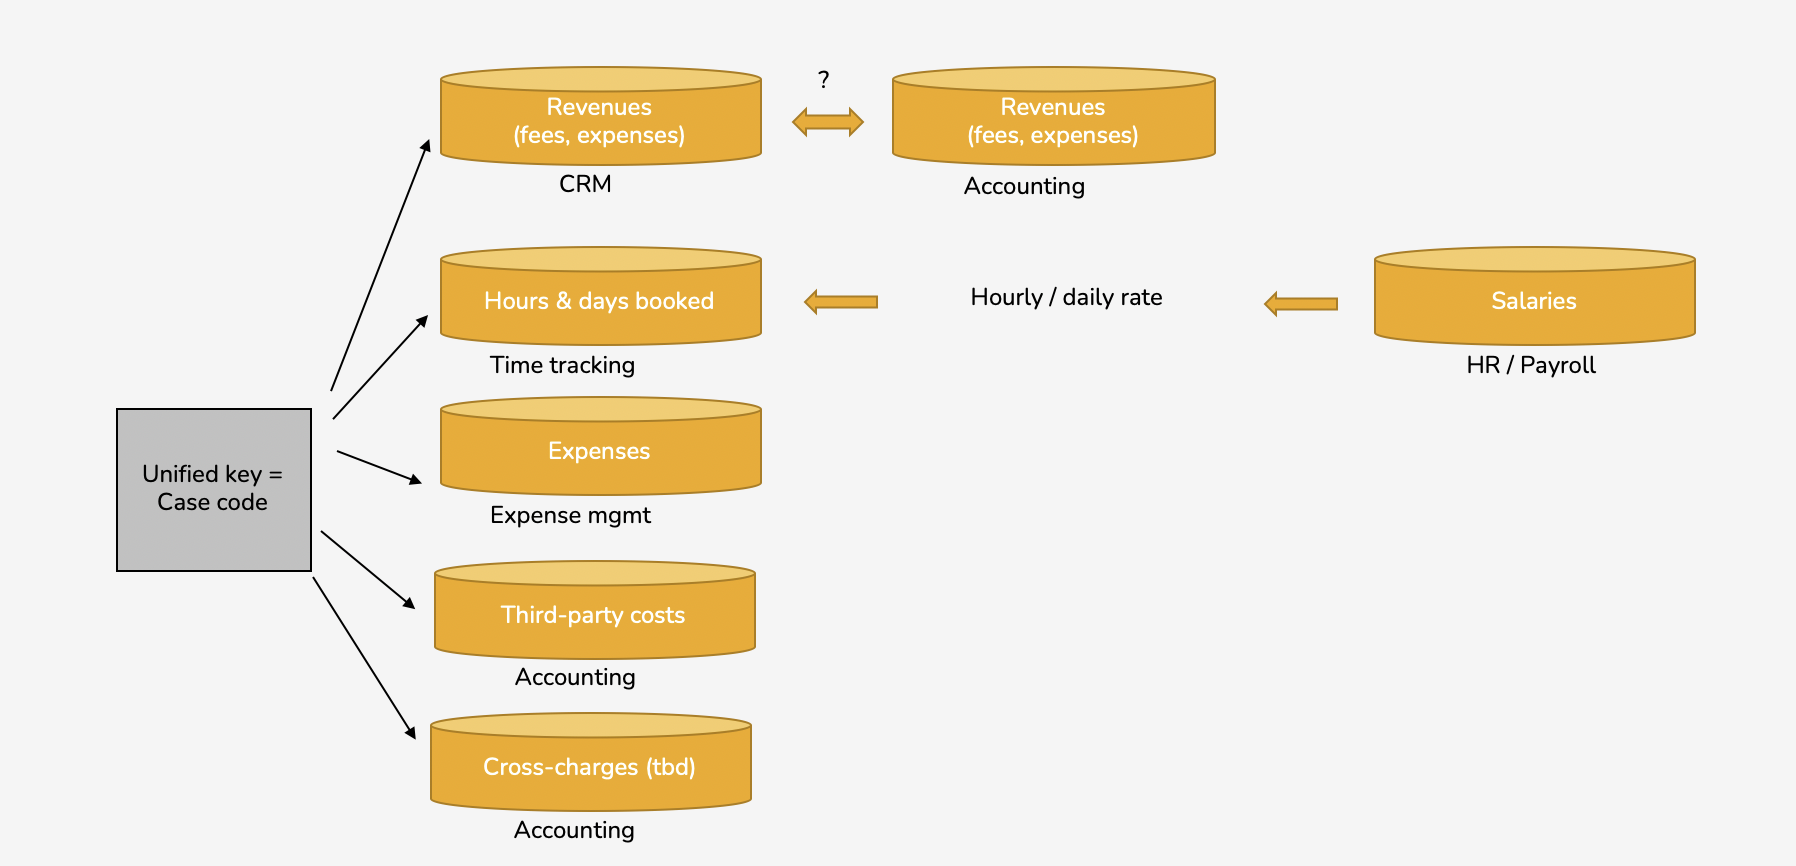
The calculation of the important KPI “project profitability” very often implies a big effort for professional service companies, as relevant data has to be manually extracted from 4-5 different data-systems (see the figure below):
Solution: automated calculation of the project-profitablity in real-time enables project-managers to better steer their projects and benchmark their performance internally
ValueWorks helps professional service companies to automize their project profitability calculation and gain real-time access to the development of this key KPI. This gives every project manager an instrument for active control, especially of the project costs.
This is possible through ValueWorks own data schema that brings together all the information around a data object. ValueWorks offers a so-called Data Wizard for each operational system with the help of which the data structure of the source system is mapped to the ValueWorks data schema. The result: All information about a project can be automatically brought together by the data object “project”.
For an optimal user-experience, ValueWorks automatically generates a graphical visualization of the project profitability based on all data-points in the form of a “waterfall” image (see figure below):
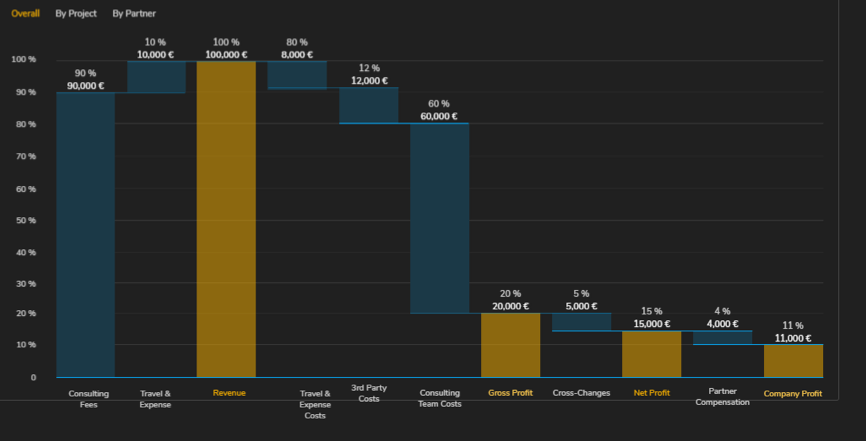
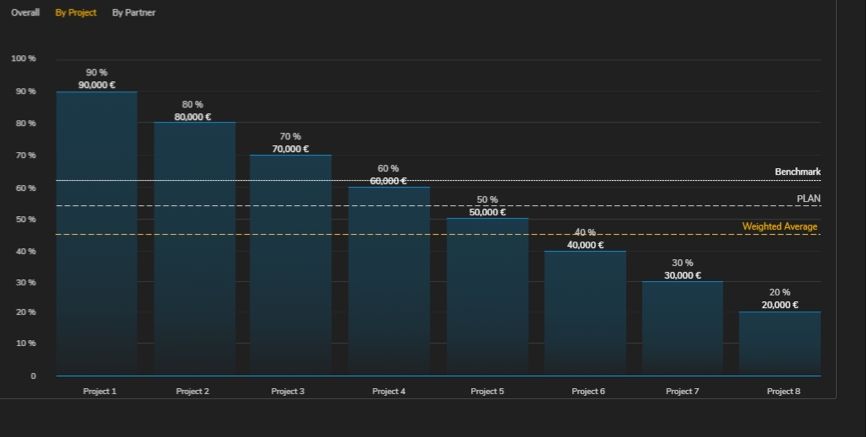
In addition, ValueWorks enables the comparison of project profitability across all projects as well as per partner or sales manager.
Customer benefits
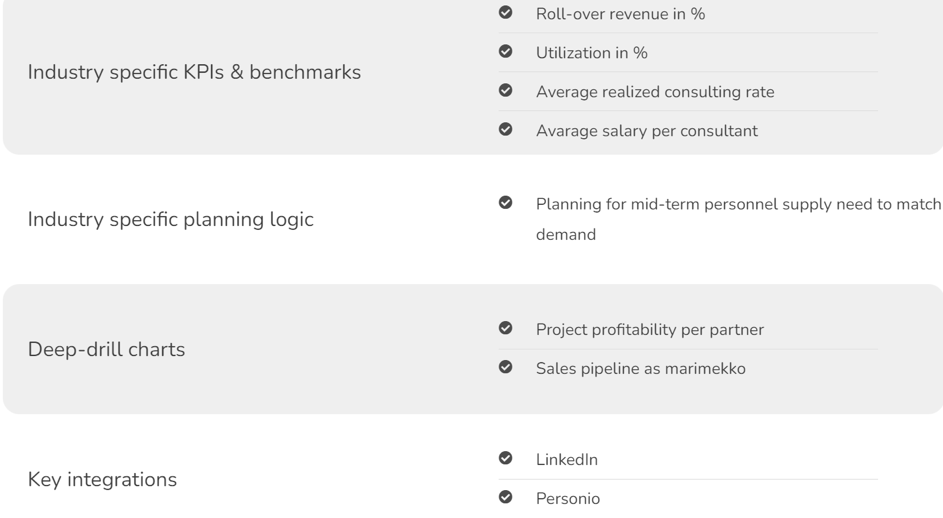
ValueWorks´professional service customers such as Excubate or MingLabs appreciate the following advantages associated with ValueWorks:
Customer feedback
Dr. Markus Anding, Founder and MD of Excubate, a boutique consulting firm for digital transformation, innovation and venture building:

“ValueWorks helps us create transparency and bias for action in our business. We need high levels of transparency to steer our business and projects on a day-to-day basis. ValueWorks helps us by providing real-time access to relevant third party and proprietary data sources and automates the data-extraction and project profitability reporting. Previously we used Excel sheets to analyze project profitability ex post after project end. Now we run an automated report that is more accurate and helps us steer our projects and teams closer to real-time.
Looking at our need for action-orientation, we use ValueWorks to translate insights into data-driven decisions: What do our partners need to do to hit sales and P/L targets, how do our teams need to manage differently, where do we need to set different focus points and how do we do in achieving these objectives? These are questions and decisions that ValueWorks helps us address in a very structured way.”
Looking at our need for action-orientation, we use ValueWorks to translate insights into data-driven decisions: What do our partners need to do to hit sales and P/L targets, how do our teams need to manage differently, where do we need to set different focus points and how do we do in achieving these objectives? These are questions and decisions that ValueWorks helps us address in a very structured way.”
Sebastian Mueller, Co-founder & COO of MINGlabs, a digital transformation consultancy based in Germany, USA and China:

“With ValueWorks we have all our data in one place. With the integrations made possible by ValueWorks, we see all of the KPIs and all the numbers in one location now instead of having to scout all the different cloud-based tools that we are using. That is really phantastic!
Our whole leadership team is aligned now by looking at the same set of numbers integrated for the business globally. In this way we ensure that although being active in different countries, we can measure our business-performance in each country with the same set of KPIs and everyone has the same view on that. Valueworks also helps us to smoothly integrate our strategic planning with our OKRs, which of course should be tied in closely with our KPIs. Bringing all of this together adds a lot of value to our business.”
Our whole leadership team is aligned now by looking at the same set of numbers integrated for the business globally. In this way we ensure that although being active in different countries, we can measure our business-performance in each country with the same set of KPIs and everyone has the same view on that. Valueworks also helps us to smoothly integrate our strategic planning with our OKRs, which of course should be tied in closely with our KPIs. Bringing all of this together adds a lot of value to our business.”

