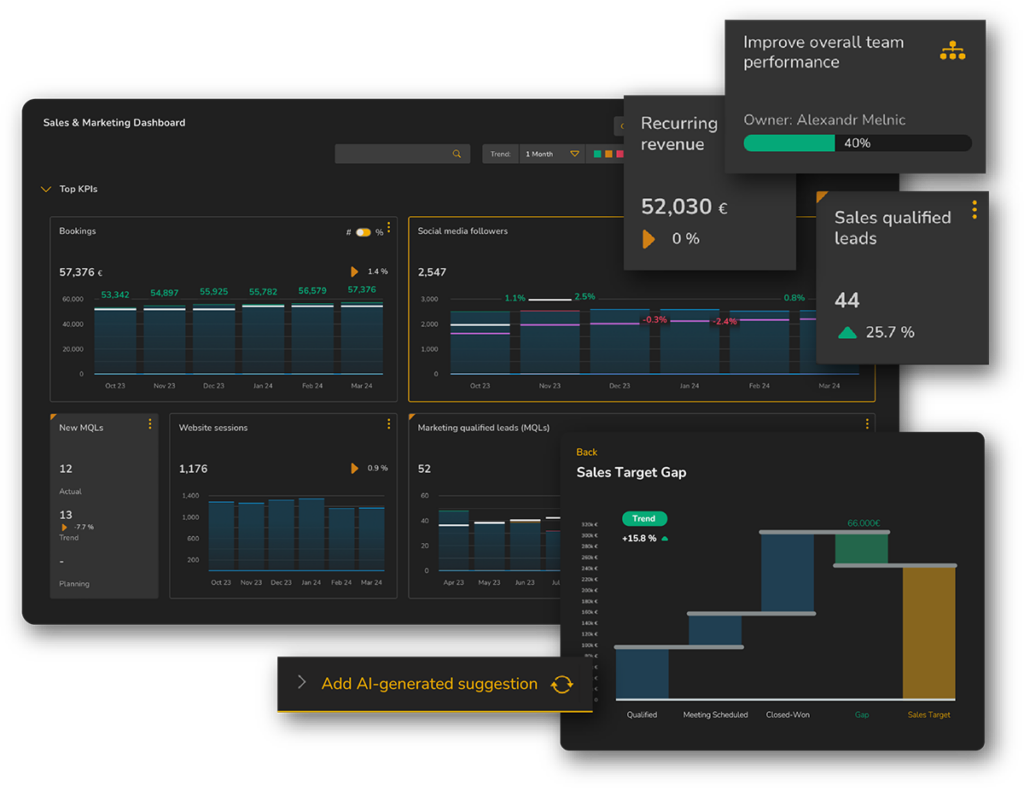


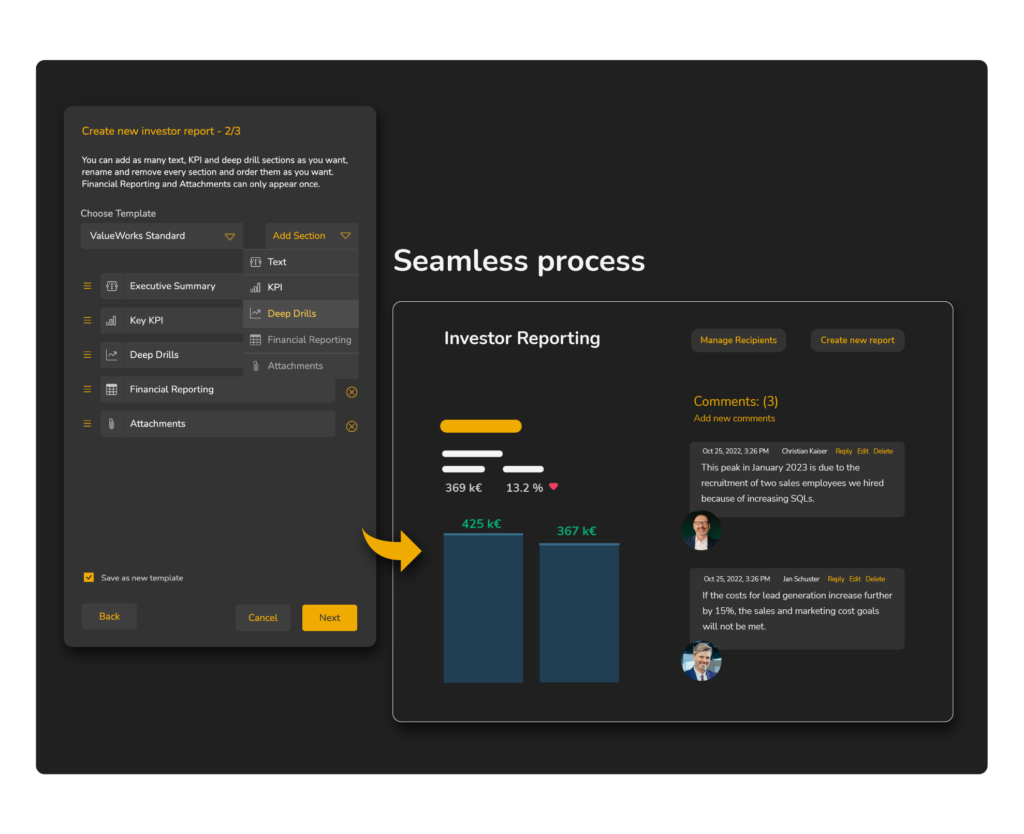
"The biggest advantage is the consolidation of the different systems, having everything in this all-in-one solution, on one platform. (...) It also enables a very simple and straightforward reporting to our investors."

Julien Pascal Then
CO-FOUNDER, managing director & CTO of coachwhisperer


By loading the video, you agree to YouTube's privacy policy.
Learn more
By using ValueWorks instead of a very extensive PowerPoint-based reporting system, we were able to increase the productivity potential of a portfolio company in the commercial area.

By loading the video, you agree to YouTube's privacy policy.
Learn more
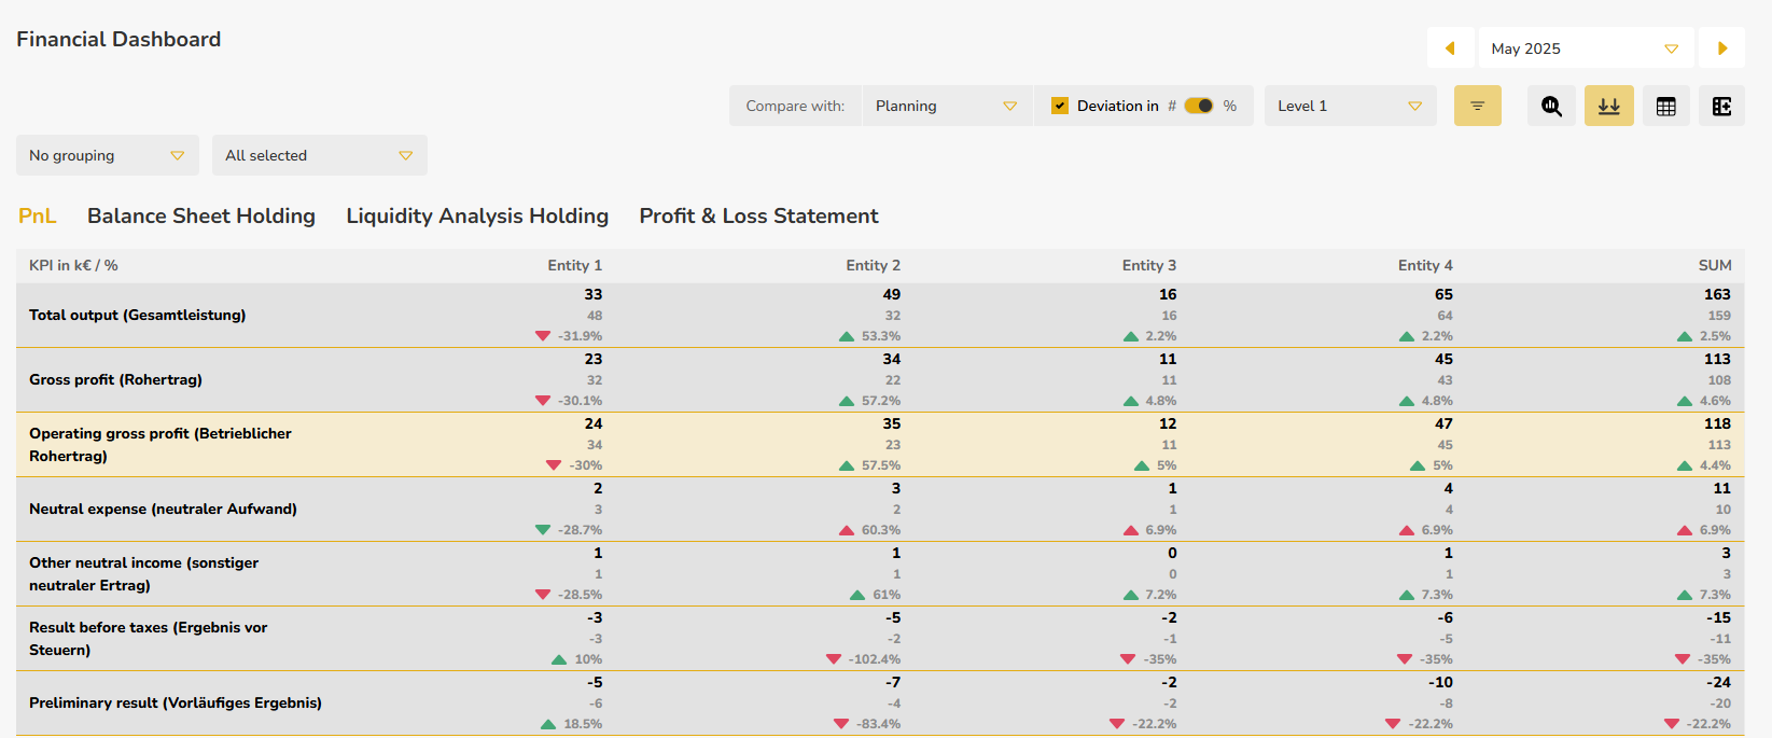
"ValueWorks has helped us to run our business faster, as data-driven decisions can now be derived faster, as the relevant data is now faster, easier and better understandable available for all executives."


By loading the video, you agree to YouTube's privacy policy.
Learn more
"I would recommend ValueWorks to everybody. Now I open the dashboard and I see all the information I want to see (...). That’s super-smart & convenient for me."